All projects04 / 08

Grafana observability

One command-centre dashboard with a row per project.

live2026

04live

  • panels on the command centre63
  • rows, one per area or project8
  • of metric history kept14 days
  • Prometheus scrape jobs6

01 / Problem

docker ps is not observability

Several projects share one machine, and I wanted one screen that says whether all of it is fine, including a display that runs unattended on the hypervisor. I also wanted the same view to show what each project is doing, not only CPU and RAM.
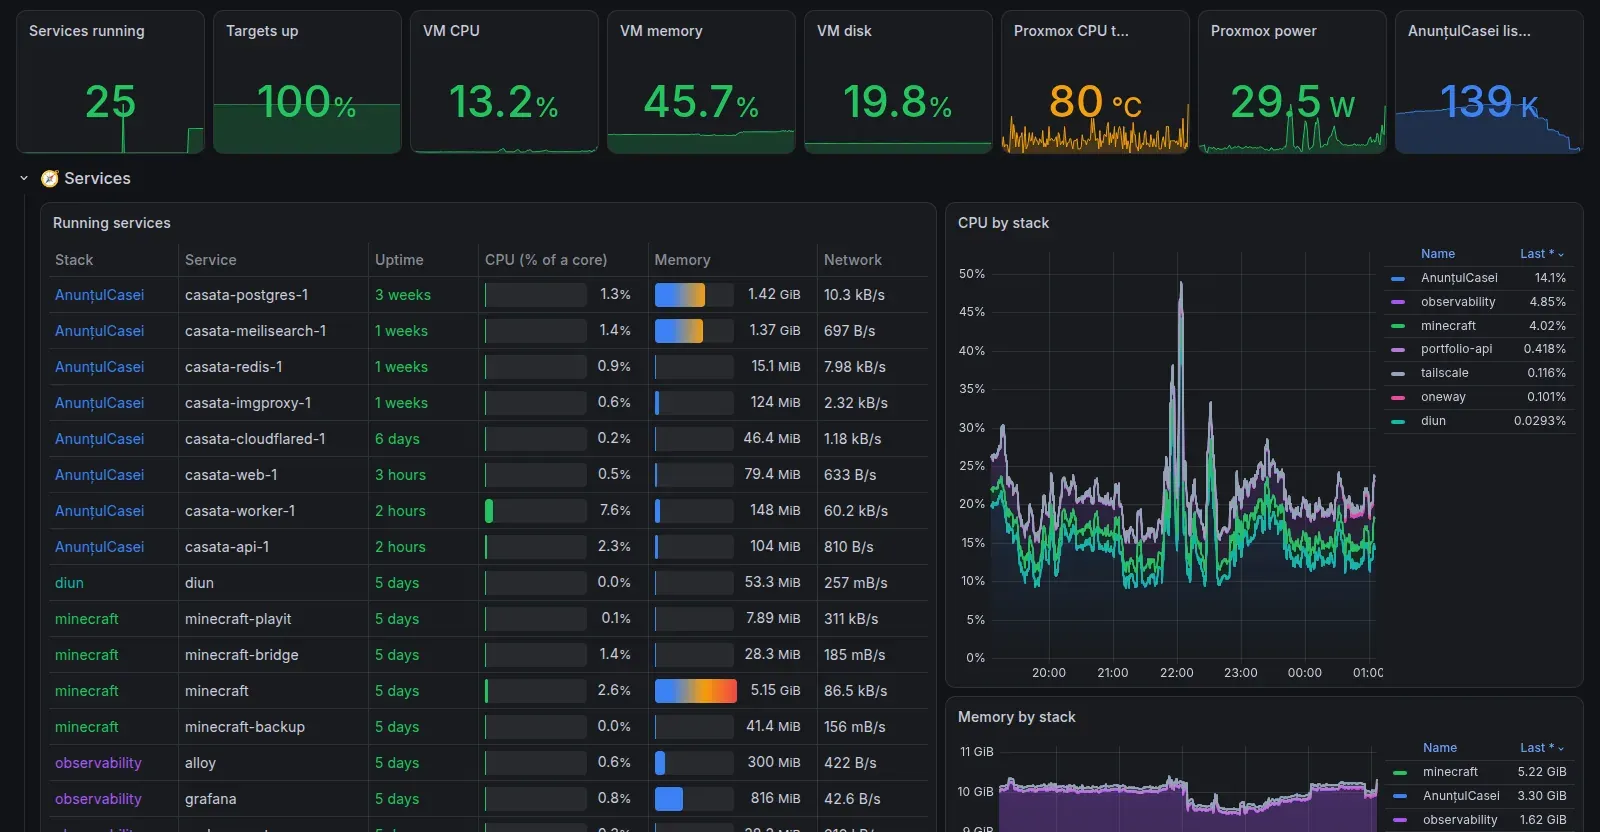
Grafana command-center dashboard in dark mode: stat tiles for running services, targets up, CPU, memory and disk, then a table of running services by stack with CPU, memory and network, and graphs of CPU and memory per stack

02 / How it works

Standard collectors plus two small exporters

Prometheus scrapes the containers, the VM and the Proxmox host. I wrote two exporters in plain Python: one turns the AnunțulCasei crawler status into metrics, the other reports traffic and errors for the public ONE·WAY demo. Alloy ships container logs to Loki, and Grafana loads dashboards and data sources from JSON files in git.

03 / The hard part

Making it cheap and self-maintaining

One cAdvisor metric group made the disk read hundreds of MB per second and pushed the load above 20 under its memory cap, so I switched it off after checking that no panel used it. Container panels filter on the Compose project label, so a new stack appears on its own and ad-hoc containers stay off. When the end-of-life log shipper was replaced by Alloy I kept the same labels, so no dashboard query had to change.

04 / Result

Plain-language panels, edited in git

The command centre has 63 panels in 8 rows, from the VM and Proxmox host to each project. A second dashboard for AnunțulCasei has a table that states in words what looks off, for example overdue or blocked crawlers, and it compares counts rather than percentages while the numbers are small. Dashboard edits go into git, because changes made only in the UI would sit in a volume without a backup.

How it works

From every container to one screen

Standard collectors cover the machines. Two small exporters cover what only a project knows about itself.

The same flow as a list, in order.

  1. Sources: Containers and hosts. The VM, the hypervisor, every stack. Goes to cAdvisor and node-exporter.
  2. Sources: Crawler status. From AnunțulCasei. Goes to Two small exporters.
  3. Sources: Demo traffic. Requests and errors on the ONE·WAY demo. Goes to Two small exporters.
  4. Sources: Container logs. Goes to Alloy.
  5. Collect: cAdvisor and node-exporter. Goes to Prometheus.
  6. Collect: Two small exporters. Plain Python, standard library only. Goes to Prometheus.
  7. Collect: Alloy. Ships logs, keeps the labels. Goes to Loki.
  8. Store: Prometheus. 14 days of metrics. Goes to Grafana.
  9. Store: Loki. Logs. Goes to Grafana.
  10. Show: Grafana. Dashboards provisioned from JSON in git. Goes to Command centre, AnunțulCasei dashboard.
  11. Read: Command centre. 63 panels in 8 rows, also on an unattended display. End of the path.
  12. Read: AnunțulCasei dashboard. States in words what looks off. End of the path.

Stack, by layer

Metrics and logs
PrometheusLokiAlloycAdvisornode-exporter
Custom exporters
Python (standard library only)
Dashboards
GrafanaProvisioned from JSON in gitSQL and PromQL panels

Live from PrometheusOffline

Scrape targets up
n/a
Series in memory
n/a